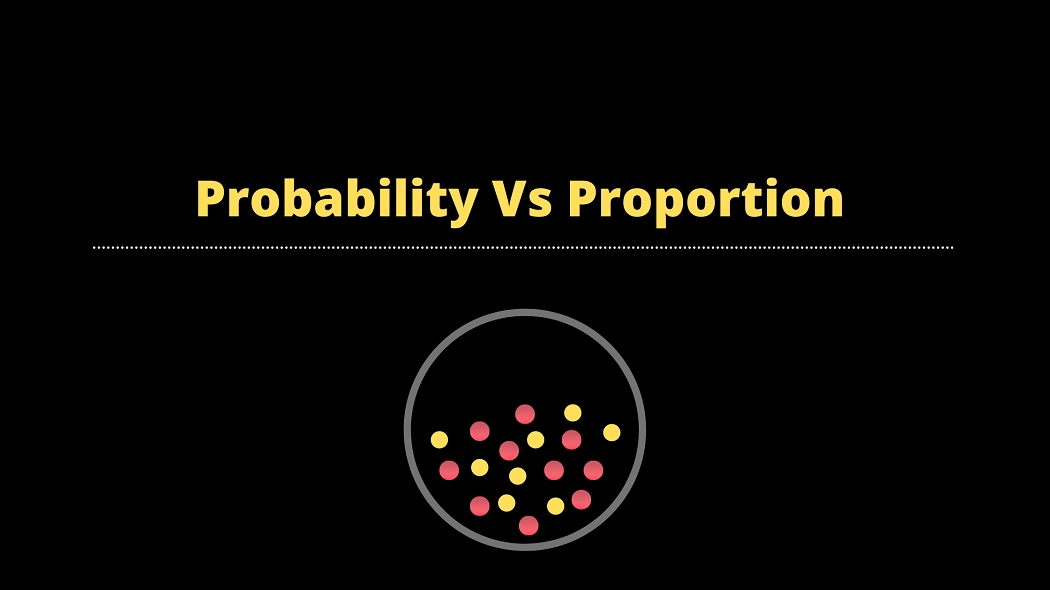
Probability and Proportion are not the same.
Although they appear to be the same however there is a very thin line between these two concepts.
Let me explain!
Probability vs Proportion
What is probability?
Wikipedia definition “Numerical descriptions of how likely an event is to occur or how likely the proportion is ture”
Simply put, it’s a way of measuring an expected outcome of an event. For example, if I flip a fair coin what are the chances of getting a Head.
As we all know, a fair coin has two possible outcomes i.e. either Head or Tail, so probability of getting a Head is around 0.5 or 50%.
Head /Head + Tail = 50% ==> (1/2 = 50%)
What is a Proportion then..?
In general, a proportion is a share of something.
For example, I have 10 balls in a Jar and if I draw 2 balls from it then the proportion of that will be 2/10 i.e. 0.2
Do you see how close it is to the probability calculation..?
Well, I know it’s still confusing (it should be) so let’s run an experiment using Python and Numpy.
Experiment Details
Let’s say I have a big Jar and it has got 15 Red Balls, 45 Green Balls & 30 White Balls, in total we have 90 Balls.
So if I pick one Ball from this Jar randomly what is the probability of picking a ‘Red’..?
Well, the answer is simple, 15/90 = 0.167 or 16.7%
Similarly for Green it’s45/ 90 =0.5 or 50% & for White it’s 30/90 = 0.33 or 33%.
These are called probabilities because we know the exact number of ‘Red’, ‘Green’ or ‘White’ balls so we can compute the probability.
However, let’s say if we randomly pick 1000 times (one Ball at a time with replacement) what are the probabilities of picking the ‘Red’, ‘Green’ & ‘White’ balls..?
You may quickly want to say the probabilities are the same as above – really? let’s see.
import numpy as np
import pandas as pd
import plotly.express as px

red = 15  # code 1
green =45 # code 2
white =30 # code 3

total_balls = red+green+white
jar = np.hstack([np.ones(red)*1,np.ones(green)*2,np.ones(white)*3])

# Calculating probability for Red, Green & White Balls
red_prob = red / total_balls
green_prob = green / total_balls
white_prob = white / total_balls

# Randomly draw Balls from Jar 1000 times
sample_size =1000
draw = np.random.choice(jar,sample_size)

# Calculate Proportions based on our draws
prop_of_red = len(draw[draw == 1]) / len(draw)
prop_of_green = len(draw[draw == 2]) / len(draw)
prop_of_white = len(draw[draw == 3]) / len(draw)

# Create A pandas DataFrame to store values
summary = pd.DataFrame({'Probability':[red_prob, green_prob, white_prob],'Proportion':[prop_of_red,prop_of_green,prop_of_white]},index=['Red','Green','White'])

# Simple chart to show our results
px.bar(data_frame=summary,y=['Probability','Proportion'],barmode='group',height=450,width=800,title= f'Probability vs Proportion - (sample size {sample_size})')
Here is a result from our experiment – you see they are close enough but not the same.
 Also just look at the below graph for comparison.

No matter how many times we run this experiment, we still get almost similar results (maybe very close to reality in some cases).
So in this case our probabilities are almost fixed based on how many Red, Green & White Balls we have in our Jar.
But the Proportions will change based on the random events or draws.
I hope this was insightful.
You can download my Jupyter notebook from GitHub to understand further in terms of this experiment.
Note: This article was inspired by Mike X Cohen Udemy Lecture 80 but my code is slightly different to what he has.
